

Collecting research data is only the beginning. The more difficult stage for many PhD scholars is deciding how to analyse the data, understand the results, and present them clearly in the thesis.
After data collection, researchers often ask: Which analysis method should I use? Is my statistical test appropriate? How should I interpret the results? Which findings should be included? How can I connect the results with my research objectives and previous studies?
Raw data does not automatically become a research finding. It must be analysed systematically and interpreted according to the research objectives.
This guide explains data analysis and interpretation in thesis writing, from selecting an appropriate method and preparing the data to presenting findings and drawing meaningful conclusions.
Turning Collected Data into Research Evidence
Research data collected through questionnaires, interviews, experiments, observations, or secondary sources is usually raw and unorganised. It may contain numbers, responses, categories, or statements that do not directly answer the research problem.
Data analysis helps convert this information into meaningful evidence. It allows researchers to identify patterns, relationships, differences, trends, or themes relevant to the study.
For example, a PhD study may examine whether employee training is related to job performance. Collecting responses from 300 employees does not itself establish the relationship. The researcher must organise the data, identify variables, select an appropriate method, and examine the results.
The purpose is to use the collected evidence to answer the questions the study was designed to investigate.
Begin with the Research Questions, Not the Software
A common mistake is choosing an analysis method because it is available in statistical software. A better approach is to begin with the research objectives, questions, and hypotheses.
For example, a study may aim to:
- Measure employee satisfaction.
- Examine the relationship between training and satisfaction.
- Determine whether training predicts satisfaction.
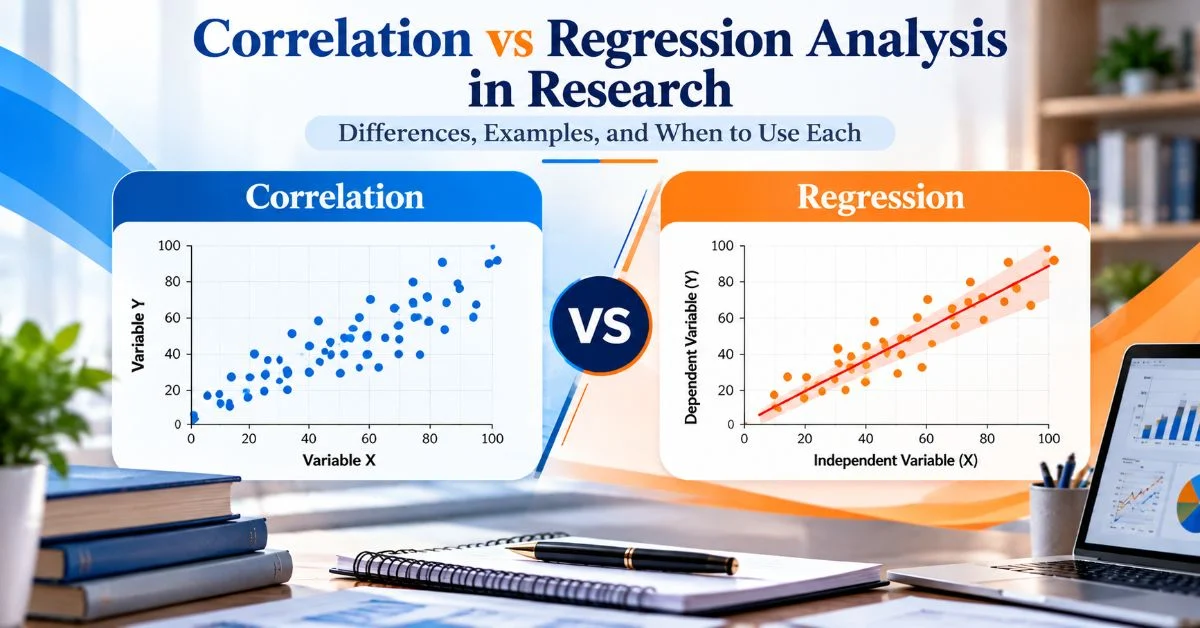
These objectives may require different approaches. Descriptive statistics can summarise satisfaction levels, correlation can examine relationships, and regression can assess predictive relationships.
The key principle is: The research question should determine the analysis method.
SPSS, R, Python, Stata, and similar tools can perform calculations, but the researcher must decide which method is suitable for the research design, variables, objectives, and assumptions.
Matching the Analysis with the Nature of the Data
The right data analysis method depends on the research design and type of information collected.
Quantitative Research
Quantitative research uses numerical data. Depending on the objectives and variables, researchers may use:
- Frequency and percentage
- Mean and standard deviation
- Correlation analysis
- Regression analysis
- t-tests
- ANOVA
- Chi-square tests
- Factor analysis
- Reliability analysis
- Structural equation modelling
Descriptive statistics summarise data, while inferential techniques examine relationships, differences, or predictive effects. The method should match the research question and satisfy relevant assumptions.

Qualitative Research
Qualitative research may involve interviews, observations, documents, or open-ended responses. Common approaches include coding, categorisation, thematic analysis, content analysis, narrative analysis, and pattern identification.
For example, interview responses may produce codes such as “limited research training,” “time pressure,” and “supervisor support.” Related codes can then be grouped into broader themes.
The process should be systematic and clearly connected to the research questions.
Clean Data Creates More Reliable Findings
Good analysis starts with good-quality data. Before analysing the dataset, PhD scholars should check for:
- Missing responses
- Duplicate records
- Incorrect entries
- Inconsistent coding
- Extreme values and outliers
- Incorrect variable definitions
Coding should remain consistent throughout the dataset. Missing data should also be reviewed before deciding how incomplete responses will be handled.
For example, removing incomplete responses without considering their effect on the sample may influence the final findings.
Proper data cleaning improves the reliability, accuracy, and transparency of thesis findings.
From Statistical Output to a Meaningful Thesis Chapter
Statistical software can generate large amounts of output, but a thesis should not contain unnecessary screenshots or tables. Present only the results that directly support the research objectives.
A useful structure is: Objective → Analysis → Result → Interpretation
For example, if the objective is to examine the relationship between research training and publication performance, state the analysis method used and present the relevant finding.
Report the appropriate statistical values according to your discipline. Then explain what the result means and how it answers the research objective. This makes the analysis chapter easier for readers and examiners to understand.

The Difference Between Finding a Result and Explaining It
Data analysis identifies what the data shows. Data interpretation explains what the finding means.
Suppose a study identifies a significant relationship between academic motivation and research productivity.
The researcher should consider:
- Why might the relationship exist?
- Does it support the hypothesis?
- Is it consistent with previous research?
- What does it mean in the study context?
- What implications does it have?
Interpretation must remain within the available evidence. For example, a correlation between two variables does not automatically prove that one causes the other.
Making the Findings Speak to Earlier Research
PhD findings should be discussed in relation to existing research.
If the results agree with previous studies, explain how they support existing knowledge. If they differ, consider possible reasons instead of simply describing them as contradictory.
Differences may be related to:
- Research population and sample
- Research setting
- Measurement instruments
- Methodology
- Theoretical framework
This comparison helps show whether the study supports existing knowledge, provides a different perspective, or identifies an area for further research.
Presenting Tables and Figures Without Overloading the Reader
Tables and figures should make thesis findings easier to understand, not add unnecessary information.
A good table should have a clear title, appropriate headings, consistent terminology, relevant results, and proper numbering.
Avoid adding every output generated by statistical software. Include only the tables and figures that directly support the research objectives.
After presenting a table or figure, explain its key finding and connect it with the relevant research objective. Do not simply write “Table 4.2 shows the results.”
Mistakes That Can Weaken Thesis Analysis
Using an Analysis Method Without Justification
Choose the method based on the research question, data, research design, and relevant assumptions.
Repeating Tables Instead of Interpreting Them
Do not repeat every number from a table. Focus on what the important findings mean.
Treating Statistical Significance as Practical Importance
A statistically significant result does not necessarily mean that the effect is large or practically important.
Ignoring Unexpected Findings
Unexpected results can provide useful research insights. Discuss them honestly instead of hiding them.
Making Causal Claims from Association
An observed association does not automatically establish causation. Interpret the finding according to the research design.
Changing Analysis to Obtain a Preferred Result
Analytical decisions should be transparent and defensible. Methods should not be changed simply to obtain statistical significance.
A Practical Review Before Finalising the Chapter
Before submitting the analysis and interpretation chapter, check:
- Does each major analysis address a research objective?
- Is the selected method suitable for the data?
- Are variables defined consistently?
- Have relevant assumptions been considered?
- Are tables and figures necessary?
- Are significant and non-significant findings reported honestly?
- Are results interpreted rather than simply repeated?
- Are important findings connected with previous research?
- Have unsupported claims been avoided?
- Do the findings lead logically toward the conclusion?
This review can help identify weaknesses before thesis evaluation or the viva.
Strengthening the Final Stage of Your PhD Research
Effective data analysis and interpretation connect the major stages of a PhD study:
Research Problem → Objectives → Methodology → Data → Analysis → Findings → Interpretation → Conclusion
When these stages connect logically, the analysis chapter clearly explains what the research discovered and why the findings matter.
PhD scholars who need guidance with selecting analysis methods, interpreting results, organising findings, or presenting a thesis analysis chapter can seek appropriate PhD research guidance while keeping their research objectives and methodology at the centre.
The goal is not simply to produce numbers or themes. It is to turn research data into clear, evidence-based findings that answer the research questions and contribute to the field of study.