

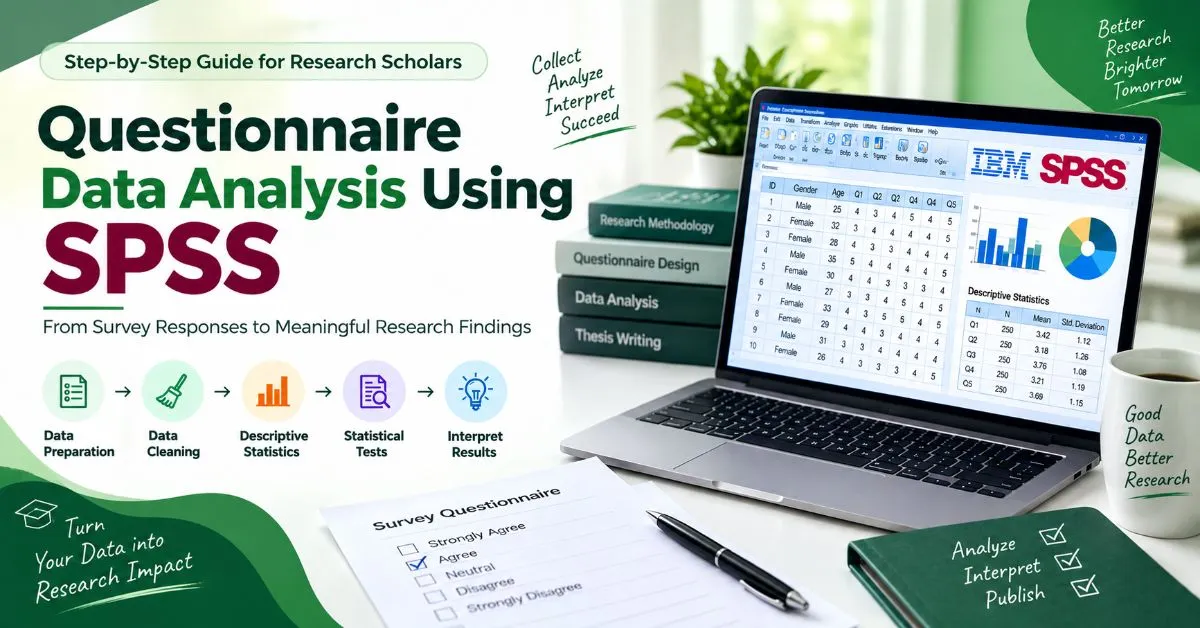
Collecting questionnaire responses is only the first step of a research study. The real challenge begins when you have hundreds of responses and need to turn them into meaningful research findings.
Questionnaire data analysis using SPSS helps researchers organize survey responses, check data quality, summarize findings, and apply statistical tests to answer research questions and test hypotheses.
For PhD scholars and research students, questionnaire data analysis becomes much easier when the dataset is properly prepared and the right statistical method is selected. Knowing which SPSS test to use, how to prepare the dataset, and how to interpret the results is essential for presenting clear and reliable research findings.
How to Analyse Questionnaire Data in SPSS
A systematic approach makes questionnaire data analysis easier and reduces errors. The process normally starts with data preparation and continues through descriptive and inferential statistical analysis.
1. Prepare and Code the Questionnaire Data
Before entering responses into SPSS, decide how each questionnaire item will be coded.
For a five-point Likert scale, you may use:
|
Response |
Code |
|
Strongly Disagree |
1 |
|
Disagree |
2 |
|
Neutral |
3 |
|
Agree |
4 |
|
Strongly Agree |
5 |
Define each variable clearly in Variable View and enter respondent data in Data View.
Use simple, consistent variable names such as AGE, GENDER, JS1, JS2, and JS3.
Proper coding is important because incorrect variable definitions can affect later statistical analysis and the interpretation of your questionnaire results.
2. Check and Clean the Dataset
Do not start statistical analysis immediately. First check the dataset for:
- Missing responses
- Incorrect values
- Duplicate records
- Data-entry errors
- Outliers
- Incorrect coding
For example, if a Likert-scale question allows values from 1 to 5 but a response is coded as 8, the data should be checked before continuing with the questionnaire data analysis.
Good data cleaning helps prevent avoidable errors from affecting your research findings.
3. Use Descriptive Statistics
Descriptive statistics provide an initial understanding of your questionnaire responses.
Depending on your variables, you may use:
- Frequency
- Percentage
- Mean
- Standard deviation
- Minimum and maximum values
Demographic variables such as gender, age group, education, and experience are commonly presented using frequency and percentage.
Likert-scale items may be summarized using mean and standard deviation, depending on your research design and methodology.
These results give you a basic picture of the sample before moving to more advanced statistical analysis.
Which SPSS Test Should You Use?
There is no single statistical test that is suitable for every questionnaire. The appropriate method for questionnaire data analysis depends on your research objective, variables, measurement level, sample, and statistical assumptions.
|
Research purpose |
Common SPSS analysis |
|
Describe responses |
Frequencies, Mean, SD |
|
Check scale reliability |
Cronbach's Alpha |
|
Examine a relationship |
Correlation |
|
Compare two groups |
Independent Samples t-test |
|
Compare three or more groups |
ANOVA |
|
Predict an outcome |
Regression |
|
Examine categorical association |
Chi-square |
|
Identify underlying factors |
Factor Analysis |
For example, if your research question asks whether training satisfaction is related to employee performance, correlation may be appropriate.
If the objective is to determine whether training satisfaction predicts employee performance, regression may be more suitable.
The statistical test should therefore be selected from the research question and methodology, not simply from the list of tests available in SPSS.

Check Questionnaire Reliability
When several questionnaire items are designed to measure the same construct, their internal consistency should generally be examined.
Cronbach's Alpha is commonly used for this purpose. It is an important part of questionnaire analysis when multiple items are intended to measure the same underlying construct.
For example, if five questionnaire statements measure research satisfaction, reliability analysis can help determine whether the items work consistently as a scale.
Do not report the alpha value alone. Explain what the result means for your questionnaire, construct, and research context.
How to Interpret SPSS Results
Running an SPSS test is only part of questionnaire data analysis. The results need to be interpreted in relation to your research questions or hypotheses.
For example, suppose a correlation produces: r = 0.62, p < 0.001
This indicates a statistically significant positive relationship between the two variables. However, a correlation does not by itself establish that one variable causes the other.
When reporting an SPSS result, clearly explain:
- The statistical test used
- The relevant statistical value
- The significance values
- Whether the hypothesis is supported
- What the finding means for the study
This makes interpreting SPSS results easier for supervisors, reviewers, and examiners to understand.
Common Mistakes in Questionnaire Data Analysis
Choosing the Wrong Statistical Test
A test should not be selected simply because it is commonly used. Consider the research objective, variables, and statistical assumptions before choosing the analysis.
Skipping Data Cleaning
Missing values, incorrect coding, duplicate responses, and data-entry errors can affect your findings.
Copying SPSS Tables Without Explanation
Raw output does not explain your research. Important statistical results should be presented clearly and followed by an appropriate interpretation.
Treating Correlation as Causation
A significant relationship between two variables does not automatically mean that one causes the other.
Ignoring Statistical Assumptions
Tests such as t-tests, ANOVA, and regression have assumptions that should be checked before drawing conclusions.
Tips for Better SPSS Questionnaire Analysis
-
Prepare a clear coding plan before entering data.
- Keep questionnaire items and SPSS variables organized.
- Clean the dataset before running statistical tests.
- Link every analysis to a research objective or hypothesis.
- Explain important SPSS findings instead of only presenting tables.
- Keep your original dataset, cleaned dataset, and SPSS output safely.
- Follow your university or journal requirements when presenting statistical results.
A clear workflow for questionnaire data analysis can also make it easier to review your findings later and explain the methodology in your thesis.
Make Your Questionnaire Results Research-Ready
Effective questionnaire data analysis is not about running as many SPSS tests as possible. It is about choosing the appropriate analysis, interpreting the findings correctly, and connecting the results to your research objectives.
If you have collected your questionnaire responses but are unsure about SPSS test selection, statistical analysis, output interpretation, or presenting the findings in your thesis or research paper, professional research support can help you turn your raw responses into clear, well-structured, and defensible research findings.