

Introduction
Have you ever looked at pages of research data and wondered, "What do these numbers or responses actually mean?" You're not alone. Many PhD scholars and researchers spend months collecting valuable data, only to struggle when it's time to explain what the findings truly reveal. This is where research data interpretation becomes one of the most important stages of the research journey.
Collecting data is only half the process. The real value lies in understanding patterns, explaining relationships, answering research questions, and connecting findings with existing knowledge. Without proper interpretation, even well-conducted research may fail to make a meaningful academic or practical impact.
Whether you're working on a PhD thesis, master's dissertation, journal article, or research project, this guide will help you understand research data interpretation in a simple yet academically sound way. You'll learn practical methods, common mistakes, expert tips, and real-world examples to interpret research findings with greater confidence and clarity.
What is Research Data Interpretation?
Research data interpretation is the process of explaining the meaning of analyzed data in relation to your research objectives, hypotheses, and existing literature. While data analysis focuses on processing and organizing data using statistical or qualitative techniques, interpretation answers the bigger question: What do these results actually mean?
The primary purpose of data interpretation is to transform raw findings into meaningful insights that contribute to academic knowledge or solve real-world problems.
A well-interpreted study helps researchers:
- Answer research questions clearly
- Validate or reject hypotheses
- Identify meaningful trends and patterns
- Support evidence-based conclusions
- Recommend future research directions
Research Data Analysis vs Research Data Interpretation
Many researchers confuse analysis with interpretation, but they serve different purposes.
|
Research Data Analysis |
Research Data Interpretation |
|
Organizes and processes data |
Explains the meaning of findings |
|
Uses statistical or qualitative methods |
Connects findings with research objectives |
|
Produces charts, tables, and results |
Explains why results occurred |
|
Focuses on numbers or coded responses |
Focuses on insights and conclusions |
Example:
Suppose a survey shows that 82% of participants prefer online learning.
- Analysis: Reports that 82% selected online learning.
- Interpretation: Suggests that flexibility, accessibility, and digital learning resources are influencing student preferences.
The interpretation provides value beyond the numbers.
Why is Research Data Interpretation Important in PhD Research?
Research interpretation strengthens every stage of academic research.
It helps researchers:
- Answer research questions with evidence.
- Support or reject research hypotheses.
- Explain the significance of findings.
- Compare results with previous studies.
- Improve thesis quality and academic credibility.
- Increase the chances of publishing in reputable journals.
For PhD scholars, interpretation demonstrates critical thinking—a quality expected by supervisors, reviewers, and journal editors.
Types of Research Data
Quantitative Data
Quantitative data includes measurable numerical information collected through surveys, experiments, questionnaires, and observations.
Examples include:
- Test scores
- Income levels
- Temperature readings
- Customer satisfaction ratings
Qualitative Data
Qualitative research focuses on experiences, opinions, behaviors, and perceptions.
Common sources include:
- Interviews
- Focus groups
- Case studies
- Open-ended survey responses
Researchers interpret themes, emotions, and recurring patterns instead of numerical values.
Mixed Methods Research
Mixed-methods research combines quantitative and qualitative approaches to provide a broader understanding of a research problem.
Step-by-Step Research Data Interpretation Process
A systematic approach leads to stronger conclusions.
Step 1: Organize the Data
Arrange datasets, interview transcripts, or survey responses in a structured format.
Step 2: Clean the Data
Identify missing values, duplicate entries, and inconsistencies before interpretation.
Step 3: Analyze the Data
Apply suitable statistical tests or qualitative coding methods.
Step 4: Identify Trends
Look for recurring relationships, differences, or unusual observations.
Step 5: Compare with Research Objectives
Every finding should relate directly to your research questions.
Step 6: Interpret Results
Explain why the findings occurred and what they imply.
Step 7: Compare with Previous Studies
Relate your findings to published literature. Agreement or disagreement with previous studies both contribute valuable knowledge.
Step 8: Draw Conclusions
Summarize the key insights while acknowledging study limitations.
Research Data Interpretation Methods
Different studies require different interpretation techniques.
Statistical Interpretation
Used for numerical data involving descriptive statistics, hypothesis testing, regression, and correlations.
Thematic Analysis
Groups qualitative responses into meaningful themes.
Content Analysis
Examines documents, media, or text for recurring concepts.
Comparative Analysis
Compares multiple datasets, groups, or case studies.
Narrative Analysis
Analyzes personal stories and experiences to identify behaviors, perspectives, and social patterns.
Research Data Interpretation Examples
Example 1: Surfvey Research
A university survey finds that 78% of students prefer hybrid learning.
Interpretation: Students value flexibility while still appreciating classroom interaction.
Example 2: Experimental Research
An experimental study shows students receiving interactive teaching methods scored significantly higher than the control group.
Interpretation: Interactive teaching positively influences academic performance.
Example 3: Interview Research
Several interview participants mention workplace stress affecting productivity.
Interpretation: Workplace stress appears to be a major factor influencing employee performance.
These examples demonstrate how interpretation connects results with practical meaning.
Best Practices for Accurate Research Data Interpretation
Accurate research data interpretation requires more than presenting results—it involves explaining findings objectively and meaningfully. Following a few best practices can improve the quality and credibility of your research.
- Keep every interpretation aligned with your research objectives and questions.
- Support conclusions with evidence from your data rather than assumptions.
- Compare your findings with previous studies to provide context.
- Acknowledge research limitations honestly instead of overlooking them.
- Use clear and simple academic language so readers can easily understand your findings.
- Review your interpretations carefully to ensure they accurately reflect the analyzed data.
These practices help produce reliable research outcomes and strengthen the overall quality of a thesis, dissertation, or journal publication.
How to Interpret Quantitative Research Data
Quantitative interpretation involves understanding statistical measures rather than simply reporting them.
Important concepts include:
- Mean: Average value
- Median: Middle value
- Mode: Most frequent value
- Standard Deviation: Variation within data
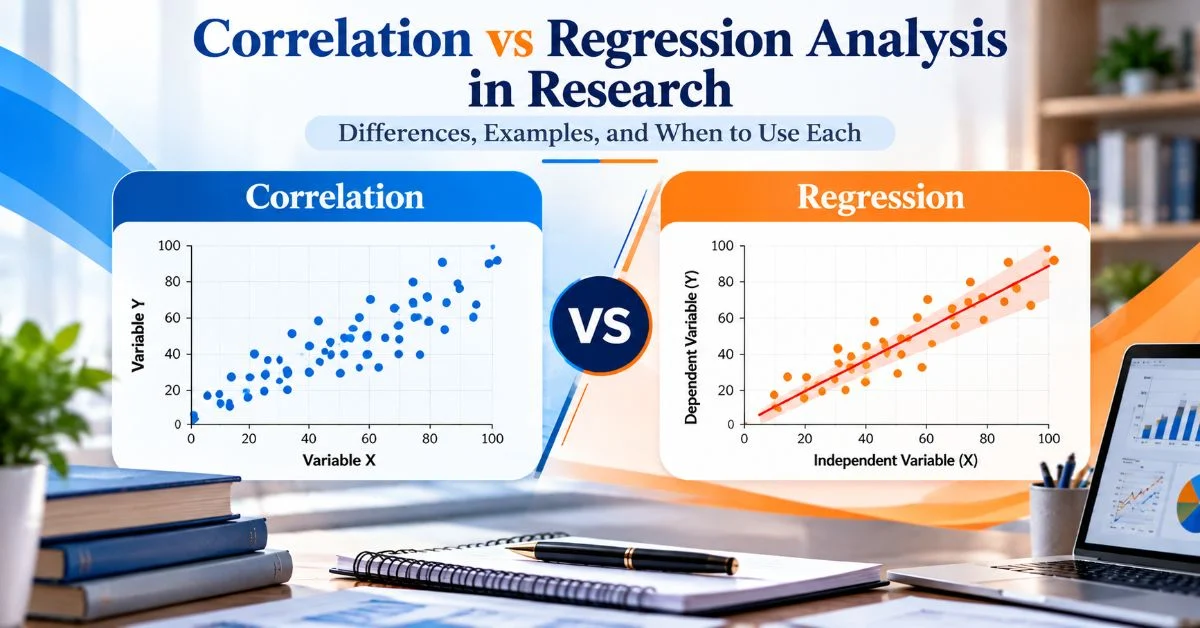
- Correlation: Strength of relationship between variables
- Regression: Predicts relationships
- p-value: Statistical significance
- Confidence Interval: Reliability of estimated values
Always explain what these statistics mean within your research context instead of presenting numbers alone.
How to Interpret Qualitative Research Data
Qualitative interpretation requires careful reading and thoughtful reflection.
Researchers generally:
- Code responses
- Group similar ideas
- Identify themes
- Explore patterns
- Explain meanings
- Draw evidence-based conclusions
The goal is to understand participants' experiences rather than count responses.
Research Data Interpretation Tools
Several software tools simplify analysis and interpretation.
|
Tool |
Best Use Case |
|
SPSS |
Statistical analysis for survey and quantitative research |
|
R |
Advanced statistical computing and research analytics |
|
Python |
Data analysis, machine learning, and visualization |
|
MATLAB |
Engineering and scientific research |
|
Excel |
Basic statistical calculations and data organization |
|
NVivo |
Qualitative research, interviews, and thematic analysis |
|
ATLAS.ti |
Coding and interpreting qualitative research data |
Choosing the right tool depends on your research methodology, data type, and analytical requirements. Selecting appropriate software improves the accuracy, efficiency, and reliability of research data interpretation.
Common Challenges and Solutions in Research Data Interpretation
Researchers often face difficulties while interpreting research findings. Understanding these challenges and applying appropriate solutions helps improve the accuracy of the final conclusions.
|
Challenge |
Practical Solution |
|
Missing or incomplete data |
Clean the dataset and use appropriate methods to handle missing values. |
|
Outliers in the dataset |
Investigate unusual values before deciding whether to remove or retain them. |
|
Research bias |
Follow objective interpretation methods and rely on evidence rather than personal opinions. |
|
Small sample size |
Clearly mention it as a study limitation and avoid overgeneralizing the findings. |
|
Confusing analysis with interpretation |
First analyze the data, then explain what the results mean in relation to the research objectives. |
By addressing these challenges carefully, researchers can present findings that are accurate, transparent, and academically credible.
Common Mistakes to Avoid
Even experienced researchers can make interpretation errors.
Avoid these common mistakes:
- Confusing analysis with interpretation
- Ignoring research objectives
- Drawing unsupported conclusions
- Misreading statistical significance
- Allowing personal bias to influence findings
- Overlooking contradictory evidence
- Failing to discuss study limitations
Objective interpretation always strengthens research credibility.
Need Expert Support for Research Data Analysis?
If you're finding it difficult to interpret research findings or choose the right statistical methods, professional guidance can save valuable time while improving the quality of your work.
Researchers often seek assistance with:
- SPSS data analysis
- MATLAB implementation
- Python for research analytics
- R programming
- NVivo qualitative analysis
- Thesis and dissertation support
- Research methodology guidance
- Journal paper preparation and publication support
Seeking expert feedback can help ensure your interpretations are academically sound, well-supported, and aligned with your research objectives.
Conclusion: Turning Research Data into Meaningful Insights
Research data interpretation is more than explaining tables or statistical outputs—it is the stage where research findings gain meaning and value. Thoughtful interpretation transforms analyzed data into evidence-based conclusions that answer research questions, support academic arguments, and contribute to future knowledge.
By following a structured interpretation process, using appropriate methods and tools, avoiding common mistakes, and maintaining objectivity, researchers can produce stronger theses, higher-quality dissertations, and impactful journal publications.
Whether you are a PhD scholar, master's student, academic researcher, or research professional, mastering research data interpretation will improve both the quality and credibility of your research. If you need expert guidance with research data analysis, statistical interpretation, or thesis writing, professional support can help you achieve accurate, reliable, and academically sound research outcomes.