

After completing PhD data collection, many researchers face an important question: Which statistical analysis should I use for my PhD research? Having a questionnaire, dataset, research objectives, and hypotheses is not enough. You also need to select methods that match your research questions, variables, measurement approach, and study design.
Choosing between a t-test, ANOVA, correlation, regression, chi-square, factor analysis, or Structural Equation Modeling (SEM) can be confusing. The appropriate statistical analysis helps PhD scholars produce defensible findings, interpret results correctly, and prepare stronger thesis chapters.
How to Choose the Right Statistical Method
The research objective should guide your statistical analysis rather than choosing a test simply because it is available in software.
|
Research Purpose |
Common Statistical Method |
|
Describe the research sample |
Descriptive statistics |
|
Compare two groups |
t-test |
|
Compare three or more groups |
ANOVA |
|
Examine categorical associations |
Chi-square test |
|
Measure relationships |
Correlation |
|
Identify predictors |
Regression |
|
Examine questionnaire dimensions |
Factor analysis |
|
Test complex relationships |
SEM |
For example, in a PhD study examining research productivity among university faculty, descriptive statistics can summarize participants, a t-test can compare two groups, ANOVA can compare multiple disciplines, correlation can examine relationships, and regression can identify predictors.
Therefore, your research objectives and hypotheses should be mapped to suitable statistical methods before final testing.

Descriptive Statistics for PhD Data
Descriptive statistics provide an initial understanding of your dataset. Common measures include frequency, percentage, mean, median, standard deviation, minimum, and maximum.
For example, if 300 PhD scholars participate in a study measuring research skills, you can report their mean research-skills score and standard deviation along with relevant demographic characteristics.
This first stage of statistical analysis helps readers understand the sample and distribution of the collected data before hypothesis testing begins.
t-Test for Comparing Two Groups
A t-test is commonly used when a researcher wants to compare the means of two groups.
For example, a PhD researcher may compare research competency between scholars who received research-methodology training and those who did not.
An independent-samples t-test may be appropriate when two independent groups are being compared. When the same participants are measured before and after an intervention, a paired-samples t-test may be more suitable.
The correct choice depends on the research design, variables, and assumptions.
ANOVA for Three or More Groups
Analysis of Variance (ANOVA) is commonly used to compare means across three or more groups.
Suppose a researcher wants to compare research satisfaction among scholars from Engineering, Management, Social Sciences, and Life Sciences. ANOVA can determine whether there is evidence of a difference among the group means.
If the overall result is significant, suitable post-hoc tests can help identify which groups differ.
ANOVA should be selected because it fits the research question and data, not simply because it is a commonly available statistical method.
Chi-Square Test for Categorical Data
The chi-square test is generally used to examine associations between categorical variables.
For example, a researcher could investigate whether research-methodology training status is associated with preferred statistical software.
This statistical analysis can help determine whether evidence of an association exists between categorical variables when the relevant assumptions are satisfied.
However, an association does not automatically establish causation. Results should always be interpreted within the research design and theoretical context.
Correlation Analysis for Relationships
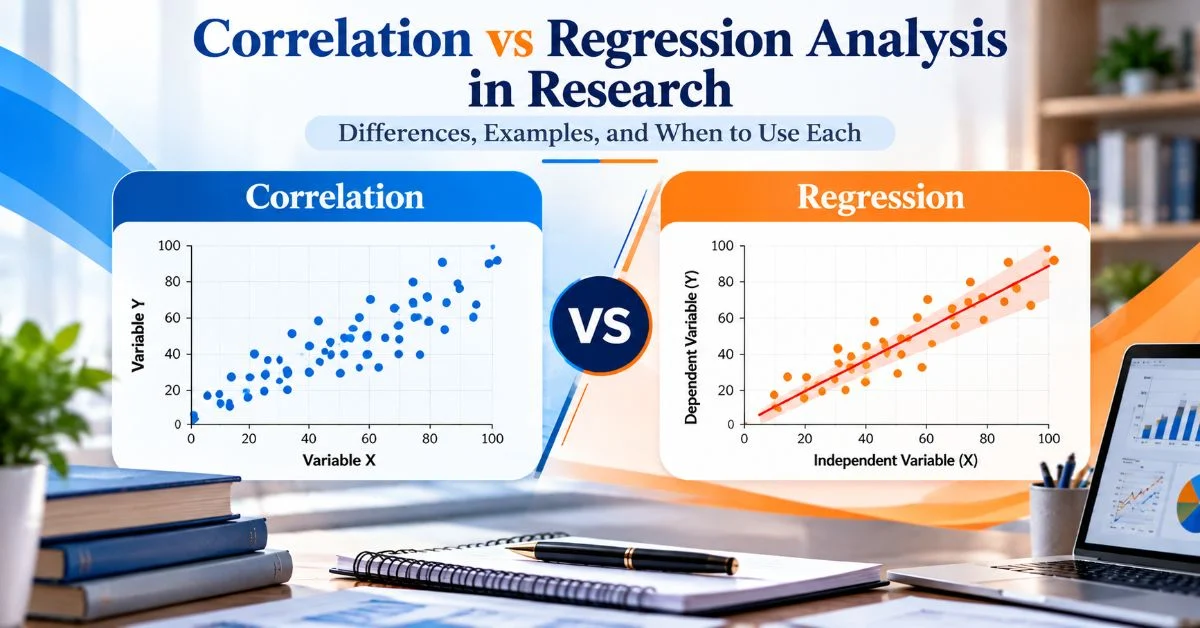
Correlation analysis examines the strength and direction of association between variables.
For example: Research experience ↔ Publication output
A positive correlation indicates that higher values of one variable tend to be associated with higher values of another variable. However, correlation does not establish cause and effect.
When conducting statistical analysis, researchers should therefore distinguish between an observed relationship and a causal conclusion.
Regression Analysis for Predictors
Regression analysis is useful when researchers want to examine how one or more predictor variables relate to an outcome.
For example, if research productivity is the dependent variable, possible predictors may include:
- Research experience
- Research training
- Institutional support
- Research funding
- Supervisor interaction
Multiple regression allows several predictors to be examined within the same model.
When interpreting regression results, PhD scholars should consider coefficients, confidence intervals, model fit, assumptions, and practical significance rather than focusing only on p-values.
Statistical Analysis for PhD Questionnaire Data
Questionnaire-based research often requires multiple stages of questionnaire data analysis. A possible workflow is:
Data screening → Descriptive analysis → Reliability assessment → Measurement assessment → Hypothesis testing
For example, a questionnaire may contain 20 items designed to measure research motivation. Before testing relationships involving that construct, researchers may need to evaluate whether the items provide an appropriate and reliable measurement.
Depending on the research design, this can involve reliability analysis, Exploratory Factor Analysis (EFA), and Confirmatory Factor Analysis (CFA).
The selected procedure should be justified by the questionnaire structure, measurement model, and methodology.

Factor Analysis for Questionnaire Dimensions
Factor analysis can help determine whether several questionnaire items represent a smaller number of underlying dimensions.
For example, 25 items measuring academic research capability may be designed around research methodology, data analysis, academic writing, and research communication.
Factor analysis can help investigate whether the collected data support the proposed factor structure.
Advanced statistical analysis should not be used merely to make a thesis appear more sophisticated. Every technique should have a clear methodological purpose.
SEM for Complex PhD Research Models
Structural Equation Modeling (SEM) may be appropriate when a PhD study includes multiple constructs and hypothesized relationships.
For example: Research Training → Research Skills → Research Productivity
If the conceptual framework proposes that research skills explain part of the relationship between research training and productivity, a mediation-based SEM model may be considered.
SEM can examine measurement and structural relationships within an appropriate theoretical framework. The complexity of the model should be justified by the research objectives and conceptual framework.
Statistical Software for PhD Research
The software should be selected according to the required statistical methods.
- SPSS: Surveys, descriptive statistics, t-tests, ANOVA, correlation, and regression
- R: Advanced statistics, modelling, visualization, and reproducible analysis
- Stata: Econometrics, panel data, and quantitative modelling
- Python: Data processing, statistics, visualization, and predictive analysis
- AMOS: Structural equation modelling
- SmartPLS: PLS-based structural equation modelling
For many questionnaire-based PhD studies, SPSS data analysis can support core quantitative analysis. More specialized studies may require R, Stata, Python, AMOS, SmartPLS, or discipline-specific software.
Common PhD Data Analysis Mistakes
Several mistakes can weaken statistical analysis in a thesis:
Selecting a Test Without Checking the Objective: Every statistical test should answer a clearly defined research question or hypothesis.
Ignoring Data Type: Categorical, ordinal, continuous, and other variable types may require different analytical approaches.
Skipping Assumption Checks: Depending on the procedure, researchers may need to assess assumptions such as independence, normality, linearity, or homoscedasticity.
Reporting Only p-Values: Statistical significance does not explain the complete importance of a finding. Where appropriate, report effect sizes and confidence intervals.
Copying Software Output: Software produces calculations, but the researcher must select relevant results and explain their meaning in the thesis.
Changing Methods to Obtain Significance: Statistical decisions should be based on research methodology rather than whether a preferred result appears.
Practical Tips for PhD Statistical Analysis
A stronger statistical analysis workflow can include:
- Map each research objective to an appropriate statistical method.
- Prepare an analysis plan before final hypothesis testing.
- Check missing values, coding errors, and unusual observations.
- Keep raw and cleaned datasets separately.
- Document important data-cleaning decisions.
- Check assumptions relevant to selected tests.
- Interpret findings according to research objectives.
- Report unexpected findings honestly.
- Use advanced methods only when methodologically justified.
- Seek statistical guidance for complex models.
Final Takeaway
Effective statistical analysis in PhD research is not about using the most advanced technique. It is about selecting the right method for the right research question.
A strong analysis connects your research objectives, variables, dataset, hypotheses, statistical tests, and conclusions. If you have a PhD questionnaire, research objectives, hypotheses, or dataset and are uncertain about test selection, an appropriate analysis plan can help you conduct your research systematically and avoid unnecessary thesis revisions.