Research studies often generate large amounts of information through questionnaires, surveys, experiments, and observations. However, collecting data is only the first step in a research project. Researchers must organize the collected information, identify meaningful patterns, and understand what the results reveal. Without proper analysis, raw data may be difficult to interpret and present effectively.
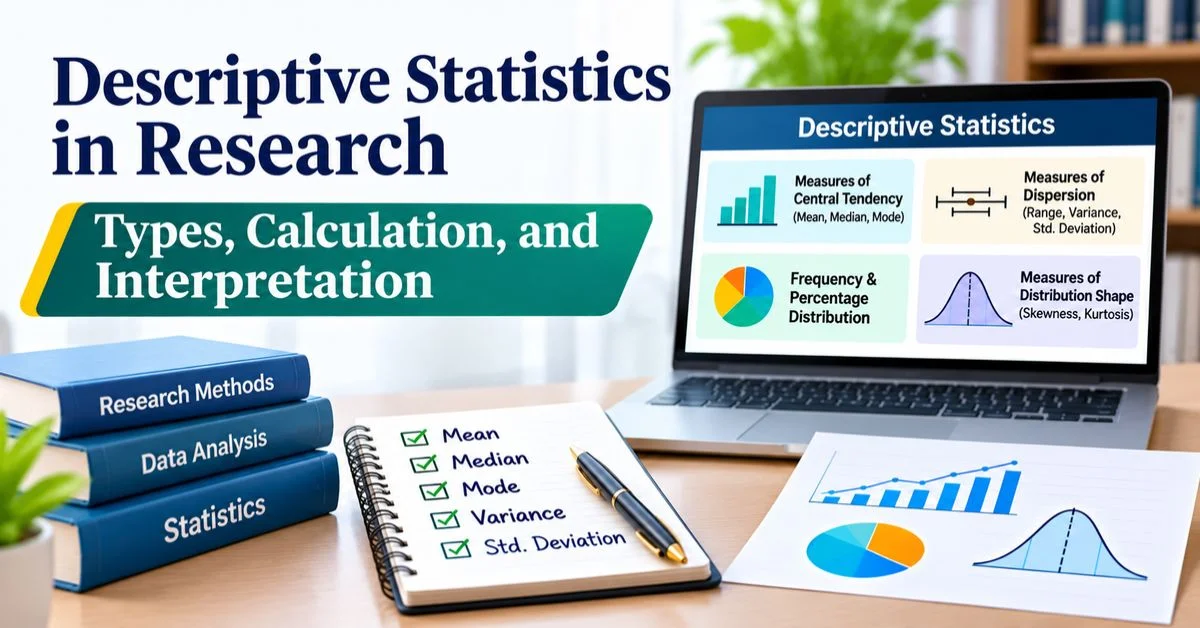
This is where Descriptive Statistics becomes essential. It provides systematic methods to summarize numerical and categorical data using measures such as mean, median, mode, frequency, and standard deviation. For PhD scholars and researchers, understanding these methods is important for analyzing research findings, preparing thesis results, and presenting accurate information in academic publications.
What Are Descriptive Statistics in Research?
Descriptive Statistics refers to methods used to organize, summarize, and present the main characteristics of collected data. It helps researchers understand the central values, distribution, and variation within a dataset.
For example, imagine a PhD researcher conducting a survey among 100 postgraduate students to study their academic performance and learning habits. The collected data may include examination scores, daily study hours, age, and preferred learning methods.
Instead of examining every response individually, researchers can use descriptive statistical analysis to identify:
- Average examination score: The overall mean score of participants.
- Middle study-hour value: The median number of daily study hours.
- Most preferred learning method: The method selected by the highest number of students.
- Academic category percentages: The proportion of students in each category.
- Variation in scores: How widely examination scores differ among students.
These summaries make research findings easier to understand and communicate.
Important: Descriptive statistics summarize the collected data. They do not independently establish cause-and-effect relationships or prove that sample findings represent an entire population.
Major Types of Descriptive Statistics Used in Research
Descriptive statistics include different methods for summarizing research data. The appropriate method depends on the type of variables and the distribution of observations.
1. Measures of Central Tendency
These measures show the central or typical value in a dataset. The three main measures include mean, median, and mode.
Mean
Mean is the average of all observations, calculated by dividing their total by the number of values.
Formula: Mean = Σx / n
Where:
- Σx = Sum of all observations
- n = Total number of observations
Example: 60, 65, 70, 75, 80
Mean = 350 / 5 = 70
Median
The median represents the middle value after arranging observations in order.
Example: 45, 50, 55, 60, 90
Median = 55
For an even dataset, calculate the mean of the two middle values. Median is useful when data contains extreme values or is skewed.
Mode
Mode represents the value that appears most often in a dataset.
Example: 10, 12, 12, 14, 15, 12, 18
Mode = 12
It helps identify the most common response or preferred category in questionnaire-based research.
2. Measures of Dispersion
These measures explain how widely observations are spread within a dataset.
Range
Range is the difference between the highest and lowest values.
Formula: Range = Maximum Value − Minimum Value
Example: 40, 50, 60, 70, 90
Range = 90 − 40 = 50
Variance
Variance measures the average squared deviation of observations from their mean.
For sample data:
[
s^2 = \frac{\sum(x-\bar{x})^2}{n-1}
]
A higher variance indicates greater variation among observations.
Standard Deviation
Standard deviation measures how much observations typically vary around their mean.
For sample data:
[
s = \sqrt{\frac{\sum(x-\bar{x})^2}{n-1}}
]
A lower standard deviation indicates values are closer to the mean, while a higher value indicates greater variation.
3. Frequency and Percentage Distribution
Frequency distribution shows how often a value or category occurs. Percentage distribution expresses each frequency as a percentage of the total observations.
Formula: Percentage = (Frequency / Total Observations) × 100
Example: A survey of 100 postgraduate students records their preferred learning methods.
|
Learning method |
Frequency |
Percentage |
|
Online learning |
45 |
45% |
|
Classroom learning |
35 |
35% |
|
Hybrid learning |
20 |
20% |
|
Total |
100 |
100% |
The results show that online learning is the most preferred method among the participants.
These measures are useful for summarizing demographic details and questionnaire responses.
4. Measures of Distribution Shape
These measures describe the shape and pattern of data distribution.
- Skewness: Measures the asymmetry of a distribution. Positive skewness has a longer right tail, while negative skewness has a longer left tail.
- Kurtosis: Describes the tail characteristics of a distribution compared with a normal distribution.
For example, income data may show positive skewness when a few individuals earn considerably more than others.
Understanding distribution shape helps researchers select appropriate summary measures, such as mean and standard deviation or median and interquartile range
How to Calculate Descriptive Statistics: A Step-by-Step Research Example
Consider a researcher studying the examination performance of eight postgraduate students.
The collected scores are:
12, 14, 14, 15, 16, 18, 21, 30
The objective is to summarize the dataset using common descriptive statistical measures.
Step 1: Calculate the Mean
Add all observations and divide the total by the number of students.
Mean = (12 + 14 + 14 + 15 + 16 + 18 + 21 + 30) / 8
Mean = 140 / 8
Mean = 17.50
Step 2: Calculate the Median
Arrange the observations in ascending order. Since there are eight observations, identify the two middle values.
Median = (15 + 16) / 2
Median = 15.50
Step 3: Identify the Mode
The value 14 appears twice, while the remaining values appear once.
Mode = 14
Step 4: Calculate the Range
Range = Maximum Value − Minimum Value
Range = 30 − 12
Range = 18
Step 5: Calculate the Sample Variance
First, calculate the difference between every observation and the mean of 17.50. Then square each difference.
|
Score |
Deviation from mean |
Squared deviation |
|
12 |
-5.50 |
30.25 |
|
14 |
-3.50 |
12.25 |
|
14 |
-3.50 |
12.25 |
|
15 |
-2.50 |
6.25 |
|
16 |
-1.50 |
2.25 |
|
18 |
0.50 |
0.25 |
|
21 |
3.50 |
12.25 |
|
30 |
12.50 |
156.25 |
|
Total |
232.00 |
For sample variance, divide the total squared deviations by n − 1.
Sample variance = 232 / (8 − 1)
Sample variance = 33.14
Step 6: Calculate the Standard Deviation
Take the square root of the sample variance.
Standard deviation = √33.14
Sample standard deviation ≈ 5.76
Summary of Calculated Results
|
Statistical measure |
Result |
|
Number of observations |
8 |
|
Mean |
17.50 |
|
Median |
15.50 |
|
Mode |
14 |
|
Minimum |
12 |
|
Maximum |
30 |
|
Range |
18 |
|
Sample variance |
33.14 |
|
Sample standard deviation |
5.76 |
This example demonstrates how researchers can calculate descriptive statistical measures using one consistent dataset.
How to Select Appropriate Descriptive Statistical Methods
Selecting the correct statistical measure is important because different variables require different approaches.
|
Type of research data |
Suitable measures |
|
Nominal data |
Frequency, percentage, mode |
|
Ordinal data |
Frequency, percentage, median, mode |
|
Approximately symmetric numerical data |
Mean and standard deviation |
|
Skewed numerical data |
Median and interquartile range |
|
Distribution analysis |
Histogram, box plot, skewness |
For example, a researcher studying students' satisfaction levels may use frequencies and percentages to summarize response categories. For examination scores, mean and standard deviation may be appropriate when the distribution supports their use.
Researchers should also consider the measurement scale and research objectives before selecting a statistical method.
Interpreting and Reporting Descriptive Statistics in a PhD Thesis
Statistical results become meaningful when researchers explain their findings in relation to their research objectives.
For example: "The average examination score was 72.50, with a standard deviation of 6.20, indicating variation in students' performance."
For clear reporting, researchers should:
- Identify the research variable.
- Report the appropriate statistical measure.
- Explain the main findings.
- Relate results to research objectives.
Use frequencies and percentages for categorical data and suitable measures such as mean, median, and standard deviation for numerical data. Follow university or journal guidelines when presenting results.
Common Mistakes in Descriptive Statistical Analysis and How to Avoid Them
Researchers should avoid these common mistakes when analyzing and reporting descriptive statistics:
- Choosing the wrong measure: Use the mean for suitable data and consider the median when values are highly skewed.
- Ignoring missing data: Check incomplete responses and report the number of valid observations.
- Confusing SD and SE: Standard deviation measures variation in data, while standard error measures the precision of an estimate.
- Ignoring outliers: Check unusual values before deciding whether to exclude them.
- Overinterpreting results: Descriptive statistics summarize data but do not prove cause-and-effect relationships.
- Presenting unclear tables: Include proper titles, labels, sample sizes, and brief explanations.
To improve accuracy, verify calculations, use consistent decimal places, choose suitable tables or charts, and explain findings in simple academic language.
Research Data Analysis Support from Takeoff PhD Guidance
Selecting suitable statistical methods, preparing datasets, and interpreting research findings can be challenging for PhD scholars, especially when working with questionnaire responses, experimental data, or multiple research variables.
Takeoff PhD Guidance offers research assistance in areas such as research methodology, quantitative data analysis, statistical interpretation, and thesis preparation. This support helps scholars understand their analytical methods and present research findings clearly and accurately.
If you need assistance with your research work, visit Takeoff PhD Guidance to explore the available services.
Conclusion
Descriptive Statistics provides an important foundation for quantitative research by transforming raw observations into understandable summaries. Measures of central tendency, dispersion, frequency, and distribution shape help researchers examine their data and identify meaningful patterns.
For PhD scholars, accurate statistical analysis requires more than calculating numerical values. It involves understanding the dataset, selecting appropriate methods, checking unusual observations, and interpreting results in relation to research objectives. Applying these principles helps researchers present clearer, more reliable, and academically meaningful findings.