

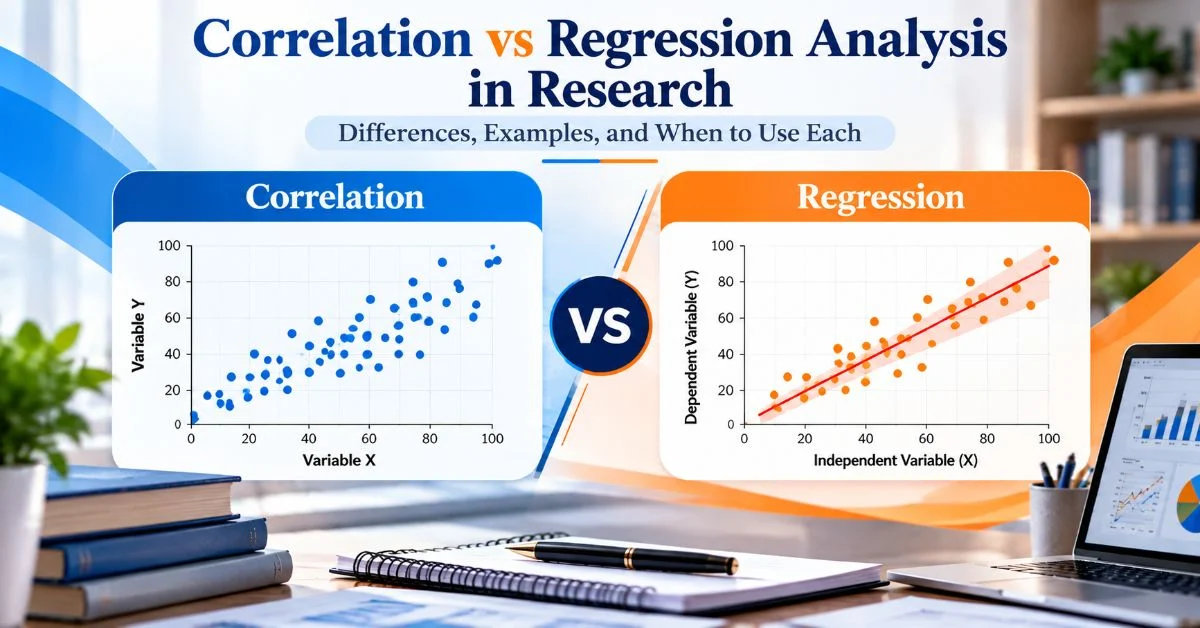
Choosing the right statistical method is an important part of academic research. PhD scholars and researchers often need to determine whether two variables are related or whether one variable can help explain or predict another. Correlation and regression are commonly used statistical methods, but they serve different purposes. Understanding Correlation vs Regression Analysis helps researchers select an appropriate statistical test, interpret findings accurately, and present meaningful results in research papers, dissertations, and theses.
What Is Correlation Analysis in Research?
Correlation analysis identifies how strongly two variables are related and whether their relationship is positive or negative. It helps researchers identify whether changes in one variable tend to occur alongside changes in another.
The correlation coefficient ranges from -1 to +1 and shows the strength and direction of the relationship between two variables.
- Positive correlation: Both variables usually rise or fall together. For example, study hours and examination scores may have a positive relationship.
- Negative correlation: One variable rises while the other tends to fall. For example, stress levels and sleep duration may have a negative relationship.
- Zero or near-zero correlation: Little or no linear relationship is observed.

What Are the Main Types of Correlation Analysis?
Researchers select a correlation method based on their data and research goals.
- Pearson correlation: Measures the strength and direction of a linear relationship between two numerical variables.
- Spearman rank correlation: Measures association between ranked variables and can be useful for ordinal data or monotonic relationships.
- Kendall's tau: Measures association using ranked observations and may be suitable for ordinal or ranked data.
The appropriate method depends on the measurement scales, data distribution, relationship pattern, potential outliers, and relevant statistical assumptions.
What Is Regression Analysis in Research?
Regression analysis examines how an outcome variable is associated with one or more explanatory variables. Researchers use regression models to estimate relationships and, when appropriate, predict outcomes.
For example, a researcher may investigate whether study hours, attendance, and previous academic performance are associated with students' examination scores.
A simple linear regression equation is:
[
Y = \beta_0 + \beta_1X + \varepsilon
]
Where:
- Y: Dependent or outcome variable
- X: Independent or explanatory variable
- β₀: Intercept
- β₁: Regression coefficient
- ε: Error term
The regression coefficient estimates the expected change in the outcome associated with a one-unit change in the explanatory variable, according to the model.
Common Types of Regression Analysis in Research
- Simple linear regression: Examines one explanatory variable in relation to a continuous outcome.
- Multiple linear regression: Examines a continuous outcome using two or more explanatory variables.
- Logistic regression: Commonly analyses binary outcomes, such as whether a student completes a course.
- Ordinal regression: Analyses ordered outcomes, such as low, moderate, and high satisfaction, when the model is appropriate.
The correct regression method depends on the outcome variable, research objective, study design, and statistical assumptions.
Correlation vs Regression Analysis: Key Differences and Comparison
Correlation and regression differ mainly in their purpose. Correlation measures the strength and direction of an association, whereas regression estimates the relationship between an outcome and one or more explanatory variables.
|
Feature |
Correlation Analysis |
Regression Analysis |
|
Main purpose |
Measures association |
Estimates relationships and may predict outcomes |
|
Variable roles |
No dependent or independent role is required |
Defines an outcome and explanatory variables |
|
Main result |
Correlation coefficient |
Regression coefficients and model statistics |
|
Coefficient range |
-1 to +1 |
Depends on the model and measurement units |
|
Prediction |
Not primarily designed for prediction |
Can support prediction when appropriate |
|
Common methods |
Pearson, Spearman, Kendall |
Linear, multiple linear, logistic, ordinal |
|
Research example |
Association between study hours and scores |
Estimating scores from study hours and attendance |
When evaluating Correlation vs Regression Analysis, researchers should remember that the two methods answer different research questions. Correlation describes an association, while regression estimates a model-based relationship involving a defined outcome. Neither method automatically proves that one variable cause another.
Correlation vs Regression Analysis Examples in Research
Practical examples show how researchers can use these statistical methods in academic and professional research.
Example 1: Study Hours and Academic Performance
A researcher collects data from 150 university students to investigate the relationship between weekly study hours and examination scores.
- Using correlation: The researcher measures the strength and direction of the association between study hours and examination scores.
- Using regression: The researcher estimates how examination scores vary with study hours. Attendance and previous grades can also be included in a multiple regression model if relevant.
The results may reveal useful patterns, but they do not automatically prove that studying longer causes higher scores.
Example 2: Employee Training and Job Performance
A researcher wants to understand whether employee training hours are associated with job performance ratings.
Correlation analysis measures the association between training hours and performance. Regression analysis can estimate this relationship while accounting for relevant factors, such as work experience.
If the study is observational, the findings should be interpreted as associations rather than proof of causation.
Example 3: Customer Satisfaction and Customer Loyalty
A business researcher investigates whether customer satisfaction is related to customer loyalty.
Correlation analysis can measure the association between satisfaction and loyalty scores. Regression analysis may estimate loyalty scores using satisfaction and other explanatory variables.
The type of regression depends on how customer loyalty is measured. A continuous score may be suitable for linear regression, while a binary outcome may require logistic regression.
When to Use Correlation Analysis in Your Research
Use correlation analysis when your primary objective is to understand whether two variables are associated and measure the strength and direction of their relationship.
Correlation may be useful when you want to:
- Explore relationships between research variables.
- Examine associations between questionnaire scores.
- Test hypotheses about associations.
- Identify relationships before conducting further statistical analysis.
- Shows how strongly two variables are related and whether they move in the same or opposite directions.
For example, a PhD scholar studying the relationship between research stress and sleep quality may use an appropriate correlation method.
Before selecting Pearson, Spearman, or Kendall correlation, consider measurement scales, the form of the relationship, potential outliers, and relevant statistical assumptions.
When to Use Regression Analysis in Your Research
Regression analysis is suitable when your research question focuses on estimating an outcome's relationship with one or more explanatory variables.
Use regression when you want to:
- Estimate how an outcome varies with an explanatory variable.
- Examine multiple explanatory variables together.
- Account for relevant covariates.
- Develop a prediction model.
- Interpret regression coefficients and model performance.
For example, a researcher studying academic performance may use multiple linear regression to examine study hours, attendance, and previous grades together.
Regression does not automatically establish causation or eliminate confounding. Causal conclusions require an appropriate research design and defensible assumptions.
Can Correlation and Regression Analysis Be Used Together in Research?
Yes. Researchers can use both methods in the same study when they address different research objectives.
For example, a study investigating employee satisfaction and productivity may first use correlation analysis to explore their association. Regression analysis can then estimate the relationship while accounting for relevant factors, such as experience or working hours.
The methodology section should explain why each method was selected, which variables were analysed, and how the findings were interpreted. Researchers should not use both methods simply because statistical software provides them.
How to Interpret Correlation and Regression Results in SPSS
SPSS is commonly used for statistical data analysis in research, including dissertations, theses, and research papers. It explains how to perform correlation analysis and use different regression models.
Steps for Correlation Analysis in SPSS
- Select Analyze → Correlate → Bivariate.
- Move the relevant variables into the analysis box.
- Choose Pearson or an appropriate rank-based method.
- Review the correlation coefficient and significance results.
Steps for Linear Regression Analysis in SPSS
- Select Analyze → Regression → Linear.
- Assign the outcome variable and explanatory variable or variables.
- Select relevant statistics and diagnostic plots.
- Review regression coefficients, model fit, confidence intervals, and diagnostic results.
When reporting statistical results, explain what the findings mean for the research question. Avoid reporting only p-values or assuming that statistical significance automatically indicates practical importance.
Common Mistakes in Correlation vs Regression Analysis
Researchers should avoid these common mistakes when selecting and interpreting statistical methods.
- Assuming correlation proves causation: An association does not establish that one variable caused another. Other factors may explain the relationship.
- Choosing a method without considering the research question: Correlation measures association, while regression estimates relationships involving a defined outcome.
- Reporting only p-values: Include relevant coefficients, confidence intervals, and effect measures where appropriate.
- Ignoring measurement scales: Variable types influence which statistical method is suitable.
- Misinterpreting coefficients: Correlation coefficients and regression coefficients have different meanings and should not be interpreted in the same way.
- Ignoring statistical assumptions: Examine assumptions relevant to the selected method and report important limitations.
Conclusion: Choosing Between Correlation vs Regression Analysis
Correlation and regression are useful statistical techniques, but each serves a different purpose. Correlation measures the strength and direction of associations, while regression estimates relationships between an outcome and explanatory variables and may be used for prediction.
Ultimately, Correlation vs Regression Analysis should be approached by identifying your research question, understanding your data, selecting a suitable statistical method, and interpreting the results accurately. These steps can help PhD scholars and researchers present clear, reliable findings in dissertations, theses, and research papers.
If you need support with research methodology, statistical method selection, or SPSS result interpretation, explore the academic guidance services offered by Takeoff PhD Guidance.